
Metrics mean different things
Teams calculate revenue, margin, pipeline or stock measures differently and cannot reconcile reports.
BI strategy · Data engineering · Tableau
ERPixel connects ERP, CRM, finance, inventory, marketing and other data sources, builds a reliable analytical layer and turns agreed business metrics into management dashboards and reports.
Business questions → Data sources → DWH and ETL → BI platform → Dashboards → Decisions
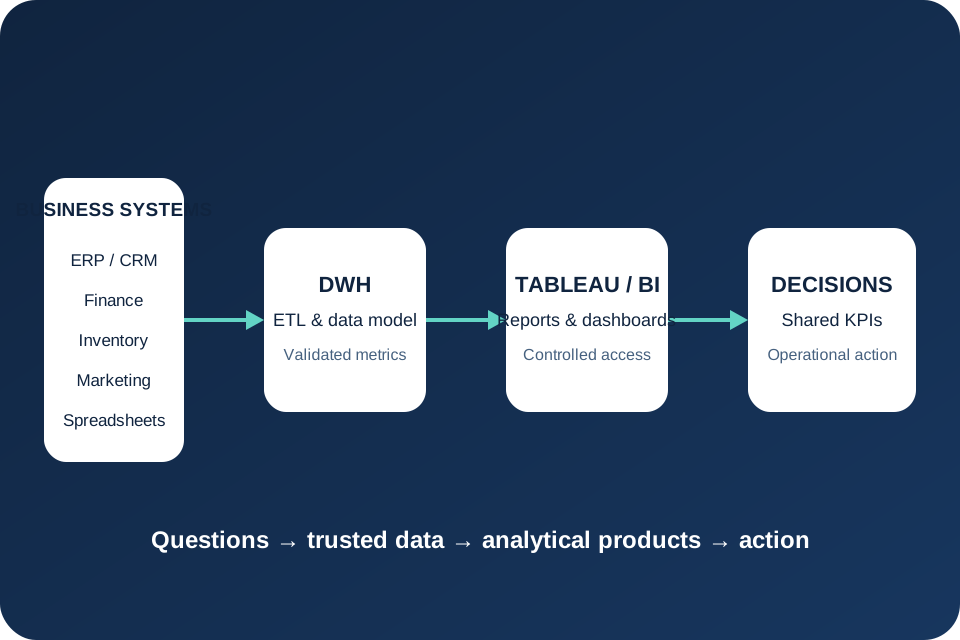
A complete analytical system
Business intelligence implementation aligns the questions decision-makers need to answer with source data, KPI definitions, a governed data model, reliable refresh pipelines, the BI platform and user access. ERPixel can deliver the full path from requirements and architecture through Tableau development, deployment, validation and training.
Common BI implementation challenges
A practical BI implementation strategy addresses the causes of unreliable reporting before expanding the dashboard estate.
Teams calculate revenue, margin, pipeline or stock measures differently and cannot reconcile reports.
ERP, CRM, accounting, marketing, databases and spreadsheets each show only part of the operating picture.
Analysts repeatedly export, clean and combine files before decision-makers can review performance.
Visuals are built before business questions, calculation rules and expected interpretation are agreed.
Failed pipelines, unclear permissions and developer-dependent reports undermine adoption and trust.
BI solution architecture
The exact architecture can use direct connections or a data warehouse. The governing principle is that every displayed KPI has an owned source, calculation and refresh path.
Ask
Decisions, users, KPIs, definitions and reporting priorities.
Source
ERP, CRM, finance, inventory, marketing, spreadsheets, databases and APIs.
Prepare
Extraction, cleaning, transformation, validation, consolidation and analytical data models.
Publish
Datasets, calculations, reports, dashboards, filters, access and scheduled refresh.
Use
Management and functional owners interpret shared metrics and take action.
Business intelligence implementation services
Scope can cover a new BI implementation, a focused reporting workstream or improvement of an existing analytical environment.
Define business questions, stakeholders, KPIs, current reports, data availability, priorities and a practical BI technology roadmap.
Choose direct connections or a warehouse, design the analytical model and consolidate data from multiple operational sources.
Extract, transform, clean, validate and schedule data pipelines across ERP, CRM, finance, marketing and external systems.
Develop datasets, metrics, calculations, dimensions, filters, parameters, reports and dashboards around approved business logic.
Plan installation, configuration, administration, publishing, access rights, refresh and production deployment.
Train business users and analysts, document the reporting model and extend dashboards or sources after adoption.
BI implementation roadmap
The plan confirms meaning and data before presentation, then validates the solution with the people responsible for the business numbers.
Identify decisions, users, existing reporting, KPI definitions, pain points and the first valuable scope.
Review systems, tables, spreadsheets, ownership, data quality, history and access constraints.
Define direct or DWH architecture, the data model, refresh frequency, access model and platform responsibilities.
Build extraction, transformation, cleansing, validation, aggregation and scheduled pipelines.
Confirm business logic and calculations, then develop and iterate the analytical presentation.
Reconcile reports with business owners and configure publishing, access rights, refresh and production operation.
Prepare users and analysts, monitor adoption and evolve the solution with new questions and sources.
Plan from the evidence
Share the decisions you need to support, current reports, source systems, users and known data-quality constraints.
Confirmed Tableau expertise
ERPixel uses Tableau as part of a governed BI solution rather than treating visualization as a substitute for reliable data.
Architecture, installation, configuration, Tableau Services Manager, administration, user access, publishing and deployment.
Business metrics, calculations, dimensions, filters, parameters and analytical navigation for management and operational users.
Tableau Prep, extracts, cleaning, transformation and preparation of reusable analytical datasets.
PostgreSQL, MySQL, MS SQL, Excel, Google Sheets, ERP and Odoo, DWH and external marketing platforms.
Data integration and governance
The BI software implementation must retain clear ownership and controls from source to published result.
Identify the authoritative system and owner for each field and business event.
Document calculation rules, dimensions, exclusions and expected interpretation before scale-out.
Validate completeness, mappings, transformations and priority totals against agreed references.
Define schedules, dependencies, failure visibility and recovery responsibilities for data pipelines.
Publish information to the appropriate users and departments through a defined permission model.
Keep data models, transformations and reporting logic understandable so the solution can continue to evolve.
Business intelligence use cases
The reporting portfolio should grow from validated questions and reusable data rather than disconnected dashboard requests.
Sales performance, pipeline analysis, conversion, win rate and forecasting-related reporting.
Management reporting, revenue, margins, profitability, unit economics and financial dashboards.
Inventory levels, stock turnover, purchasing, warehouse and supply-chain indicators.
Manufacturing performance, inventory, purchasing and operational KPIs across the production model.
Combine ERP sales with Google Ads, Google Analytics, LinkedIn and other marketing-source data.
Consolidate approved measures across departments and systems for management review.
Published BI delivery evidence
These documented projects show ERPixel working across requirements, source systems, DWH and ETL, Tableau deployment and functional reporting.
Large-scale manufacturing
ERPixel implemented Tableau Server and dashboards using ERP and external marketing data for sales, purchasing, inventory, pipeline, lead conversion and supply-chain reporting.
Diversified multi-business holding
ERPixel consolidated SAP, Odoo, accounting and Excel data through a PostgreSQL warehouse and Java ETL services, supporting twelve focused reporting workstreams.
Global advanced-device manufacturing
ERPixel connected a complex Odoo manufacturing environment with a separate data warehouse and Tableau layer, combining operational ERP information with marketing and external data for advanced analysis.
Why ERPixel
The implementation team can work on the layers that determine whether business users trust and adopt BI.
Translate operational and management questions into owned metrics and reporting requirements.
Understand how sales, finance, inventory, manufacturing and marketing data is created.
Build the analytical model and pipelines required when direct reporting is not sufficient.
Deliver dashboards and reports together with Tableau Server configuration and access.
Reconcile data and calculations with the teams responsible for the underlying business process.
Train users and continue improving the analytical solution after initial deployment.
Related implemented services
Future dashboard and Tableau pages are intentionally not linked until they are implemented.
Connect Odoo with external operational systems and establish reliable data flows.
Odoo IntegrationTurn operating events and decisions into controlled cross-system workflows.
Business Process AutomationConnect production, inventory, procurement, finance and reporting around manufacturing operations.
Manufacturing SolutionsBI implementation FAQ
It is the coordinated design and delivery of requirements, source integration, data models, DWH or direct connections, ETL, a BI platform, dashboards, access, validation and user adoption. The objective is reliable decision support, not only visualization.
ERPixel uses business discovery, data-source assessment, architecture, data integration and preparation, dashboard development, validation and deployment, followed by training and continued improvement.
The roadmap prioritizes business decisions and users, evaluates source readiness, defines target architecture and ownership, and sequences data, reporting, validation and adoption work into useful increments.
Not always. Direct connections can suit focused, well-structured sources. A DWH becomes useful when several systems, history, reusable transformations, performance, governance or consistent cross-functional metrics require a separate analytical layer.
Yes, subject to source access and technical assessment. Confirmed experience includes ERP and Odoo, SAP, accounting software, databases, spreadsheets and external marketing platforms.
Yes. ERPixel has published experience implementing Tableau Server as a centralized analytics platform and can cover architecture, installation, configuration, administration, access, publishing and deployment.
Yes. Work can include assessing existing datasets, calculations, report logic, performance, access and refresh processes before improving or extending the dashboards.
Definitions, source ownership and calculation rules are agreed first. Outputs are then reconciled with source records and existing references together with the business owners responsible for the measures.
Yes. Training can cover dashboard use, interpretation, filters and navigation for business users, plus relevant data-preparation and report-development practices for analysts.
Start with the decisions and data
Tell ERPixel which decisions the business needs to support, where the data lives and what currently makes reporting slow or unreliable.